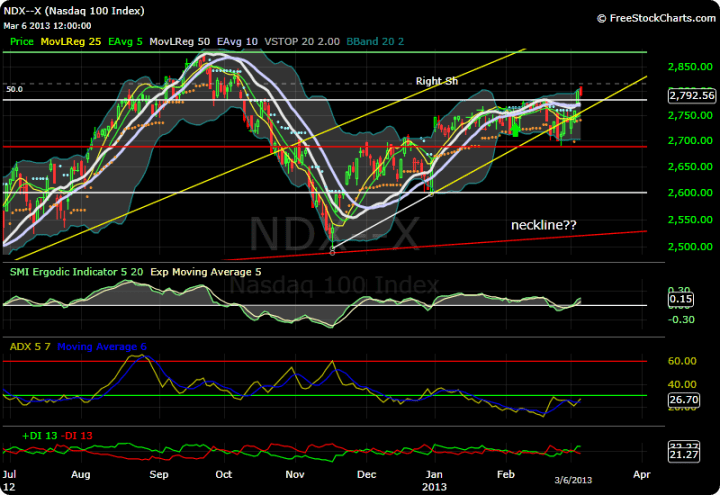
Even though the Dow has made new highs, and looks quite strong here at around 14,300, the S&P still has to exceed 1576 to take out its highs and its just at 1541. This lack of confirmation by the other indices is a bit of a warning not to be too exuberant and protective stops would be in order.
The Nasdaq 100 is nowhere near its highs of 4816 in March 2000 but more importantly its not even taken out its highs from last September 2878 and seems to have fallen back when it stuck its nose above 2800, closing today at 2792. The weekly chart still looks like a big Head and Shoulders pattern, quite bearish.
The Russell 2000 small caps has made new lifetime highs a couple weeks ago, but on this latest rally it has not been able to break above those and on a weekly chart it looks like its getting an ADX peak sell signal. This could come about in weeks or days but it will result in some sort of pull back.


Your comments and charts are very interesting. Hopefully the trend will continue upward, but how
far can it go?
Once the index has gone thru previous highs it is likely it will continue on. It may fall back to the breakout point but if that holds and it doesnt drop further, its likely to continue on. that pullback is a bit of a test of the resiliency.